
Can ChatGPT build a spreadsheet? Try the two-row exercise first
When I changed one campaign’s revenue from 60 to 80, the spreadsheet’s return on ad spend (ROAS) went from 3.2x to 3.6x. You can try the same check with two fictional campaigns and see whether the summary follows the numbers you put in.
- Apple Numbers. Ask ChatGPT to make the two-row file, then download it and open it in Numbers.
- Microsoft Excel. Build the two-row exercise in a blank workbook by pasting the sample data and formulas into two sheets.
The historical 3.04x result and the separate Summary!E7 error below concern other workbooks. Their original files remain unverified here.
I asked ChatGPT to build a spreadsheet with source rows, calculated fields, and a summary. It returned separate data and summary sheets. I followed one result back to the cells behind it before deciding what I could use.
For other claims in an AI reply, see how to verify ChatGPT sources.
The cover is AI-edited from reference images. The Claude screen and spreadsheet are illustrative, separate from the ChatGPT examples in this article.

The original Korean screenshot below shows a separate monthly-sales workbook. It includes the Summary!E7 error discussed next; the 3.04x campaign example uses a different file.
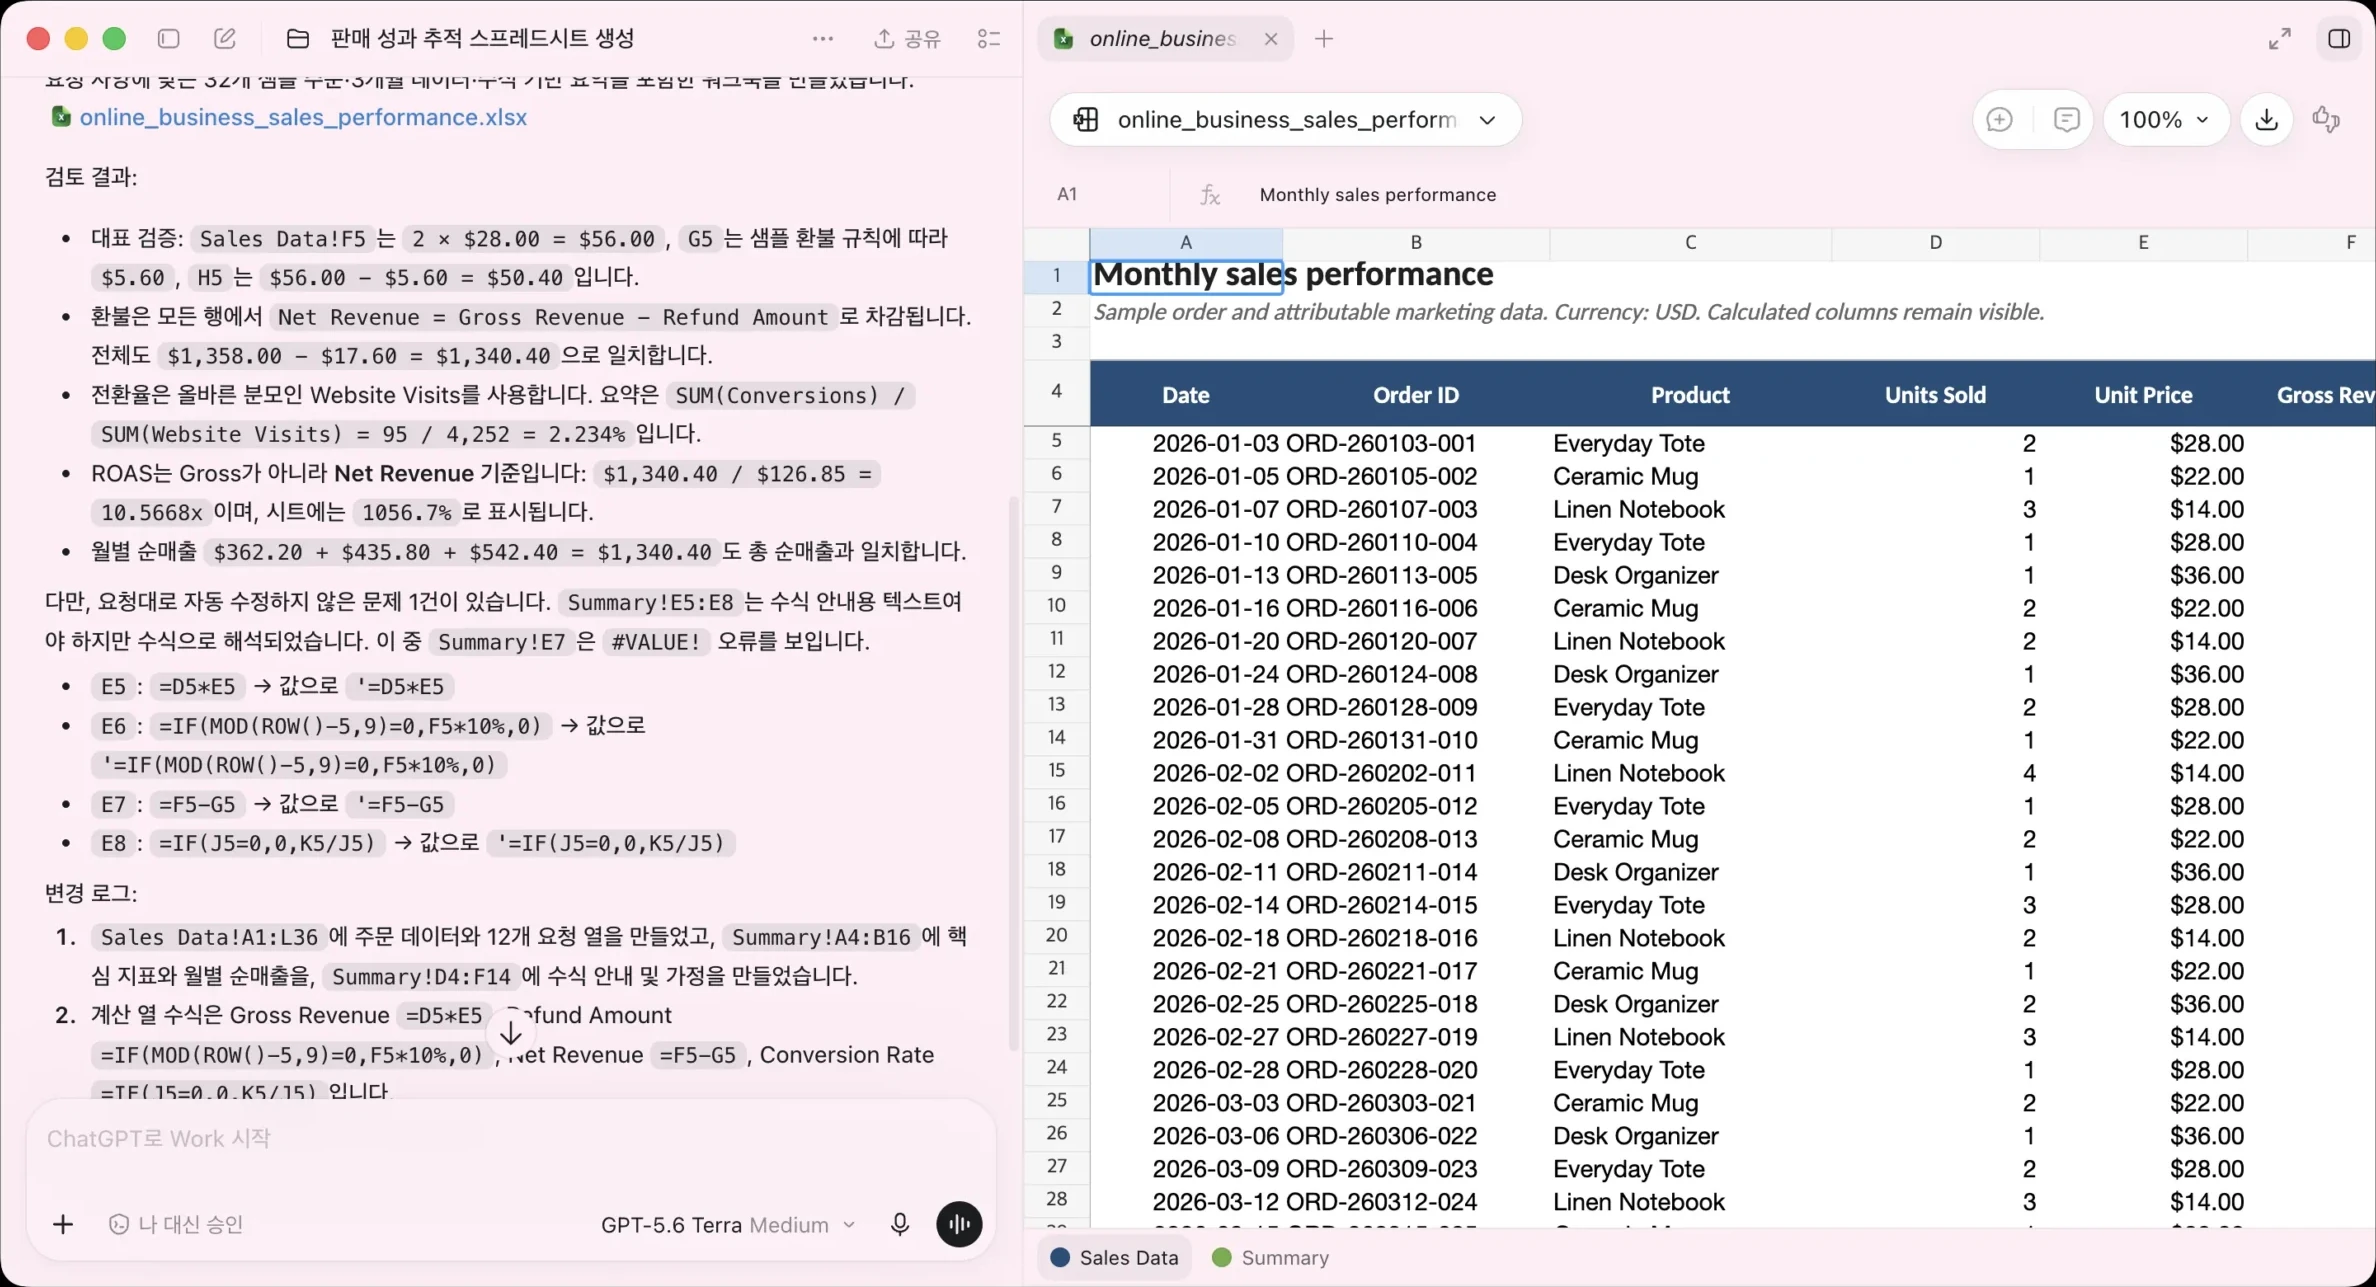
What I kept from the first version
I kept the data table, calculated columns, and summary formulas that pointed back to the source rows. The explanations helped me follow the calculations.
The separate monthly-sales file in the screenshot also had a snag: a cell meant to display an example formula was being calculated instead. ChatGPT’s review flagged a #VALUE! error in Summary!E7. I don’t have a corrected version shown here, so that issue still needs a check in the file.
That gives me two things to look for: the totals should calculate, and cells meant to explain a formula should stay readable as text. A formula is an instruction such as “divide this total by that total.” Selecting the cell lets you see whether it uses source cells or contains a fixed number.
The 3.04x result I traced
The workbook used Raw Data and Summary sheets. Its Overall ROAS was 3.04x.
ROAS means return on ad spend. Here, Revenue is the sales revenue recorded in the sample, and Ad Spend is the amount spent on advertising. The ratio was total revenue divided by total ad spend. A result of 3.04x means about $3.04 in recorded revenue for every $1 of ad spend.
The screenshot below shows ChatGPT’s reported check of 3.04x and its inputs. It doesn’t independently verify every formula.
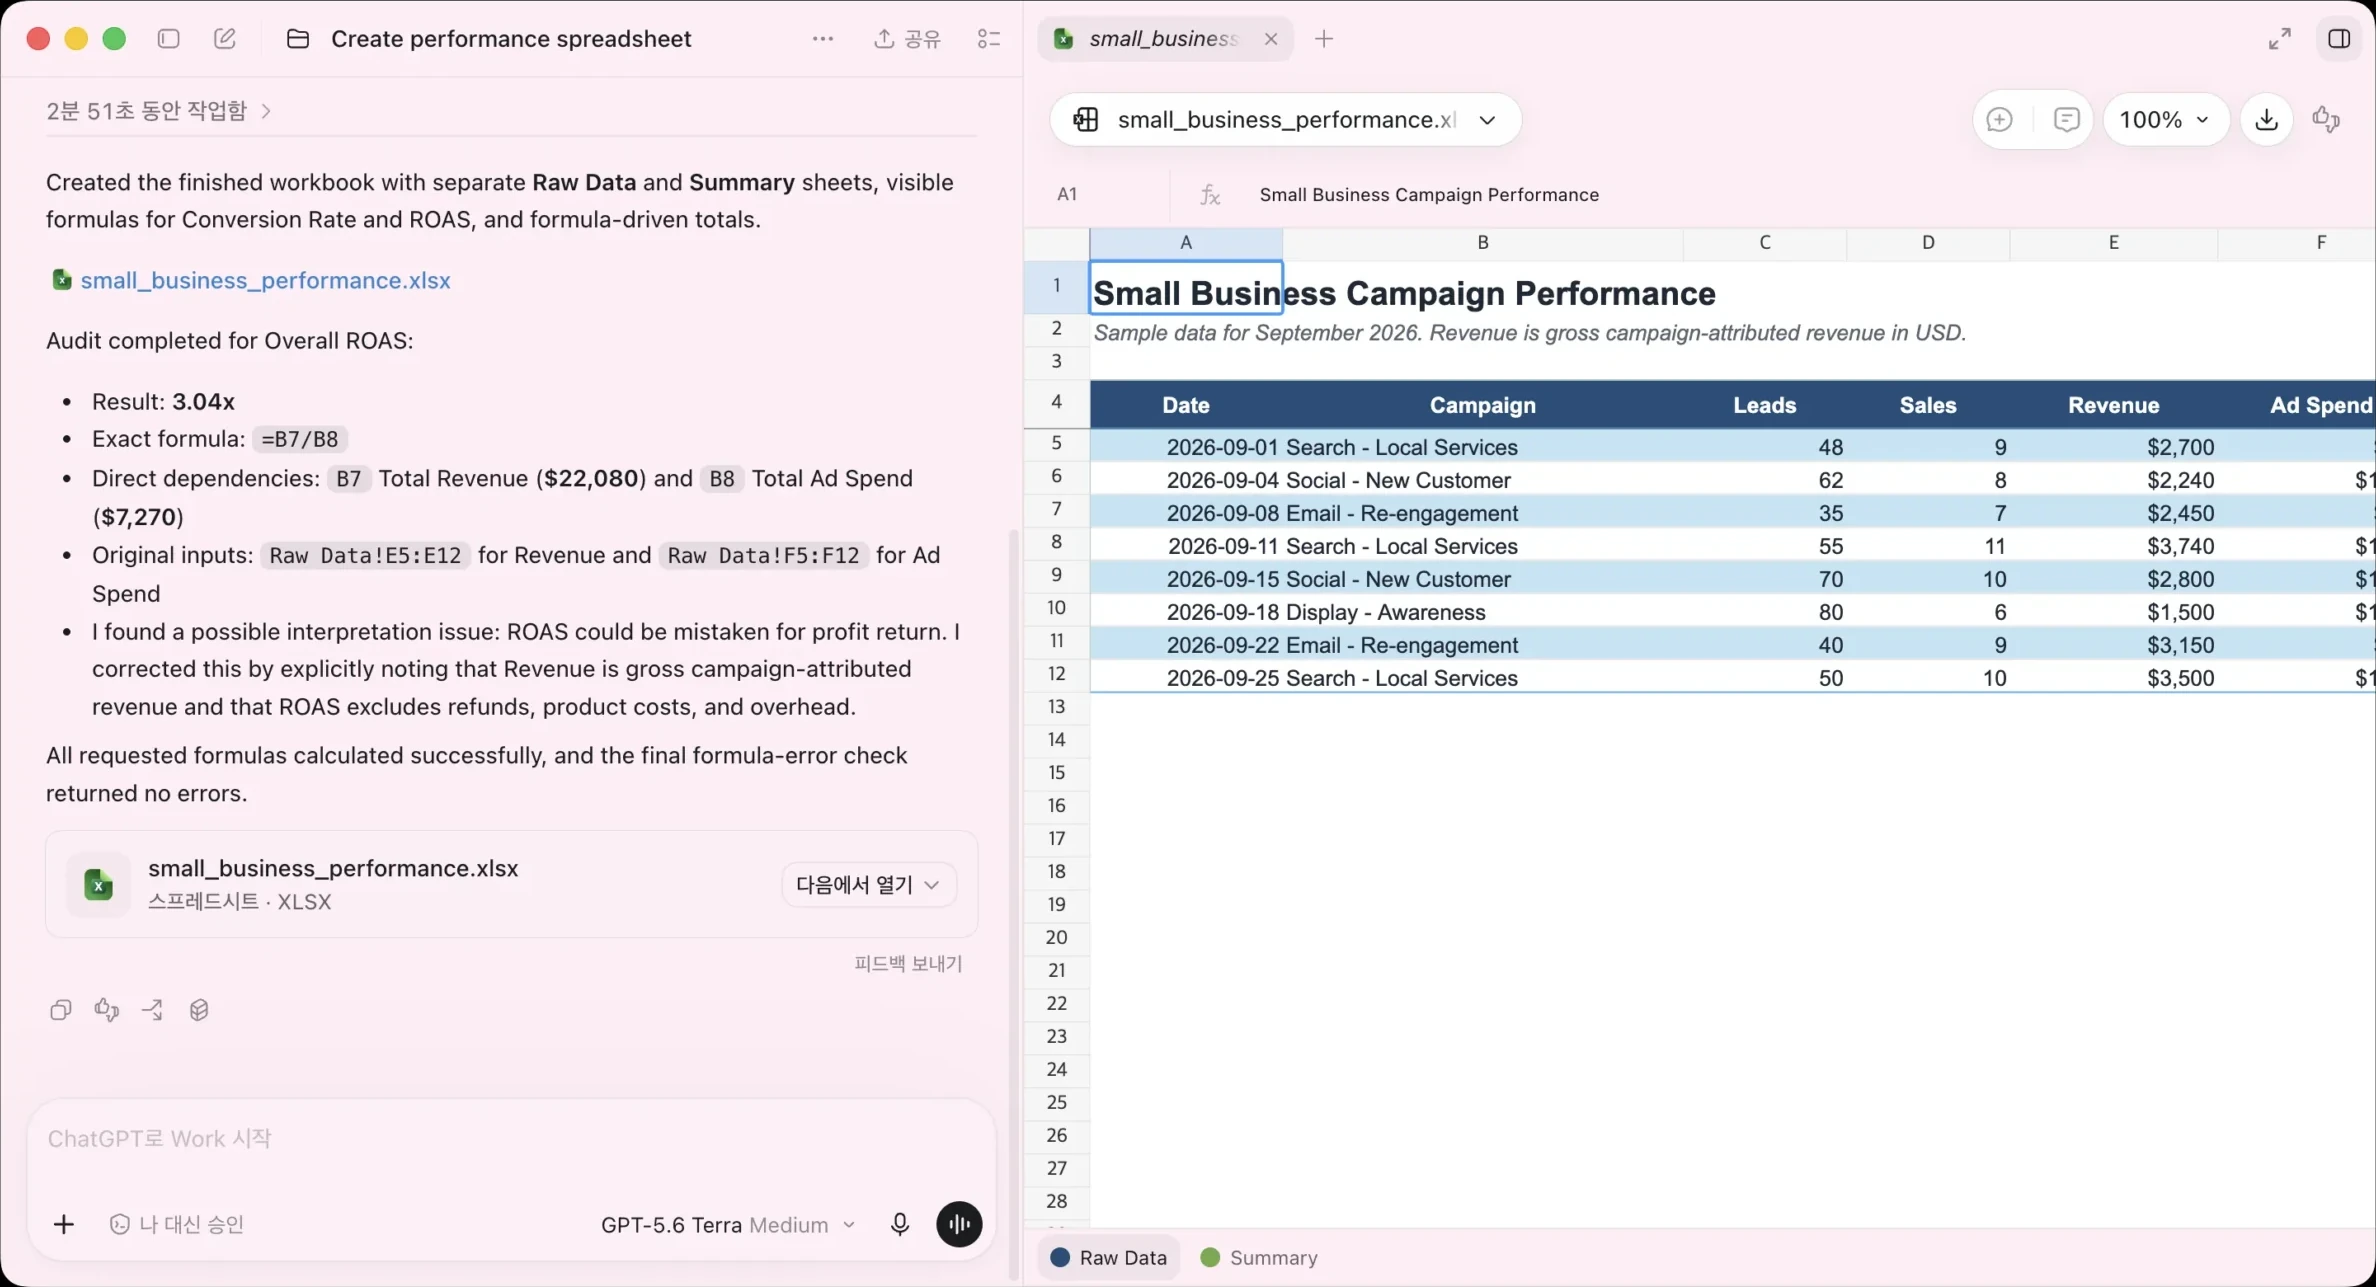
The formula in Summary!B10 was =B7/B8. The name before the exclamation mark identifies the sheet; B10 means column B, row 10.
Here is the path behind that result:
| Item | Location | Value or source |
|---|---|---|
| Total revenue | Summary!B7 | $22,080 from Raw Data!E5:E12 |
| Total ad spend | Summary!B8 | $7,270 from Raw Data!F5:F12 |
| Overall ROAS | Summary!B10 | =B7/B8 → 3.0371, shown as 3.04x |
A range such as E5:E12 means the cells from E5 through E12. The arithmetic was $22,080 ÷ $7,270 = 3.0371, rounded to 3.04x.
The screenshot below traces Summary!B10 to the revenue and ad-spend ranges in the table above.
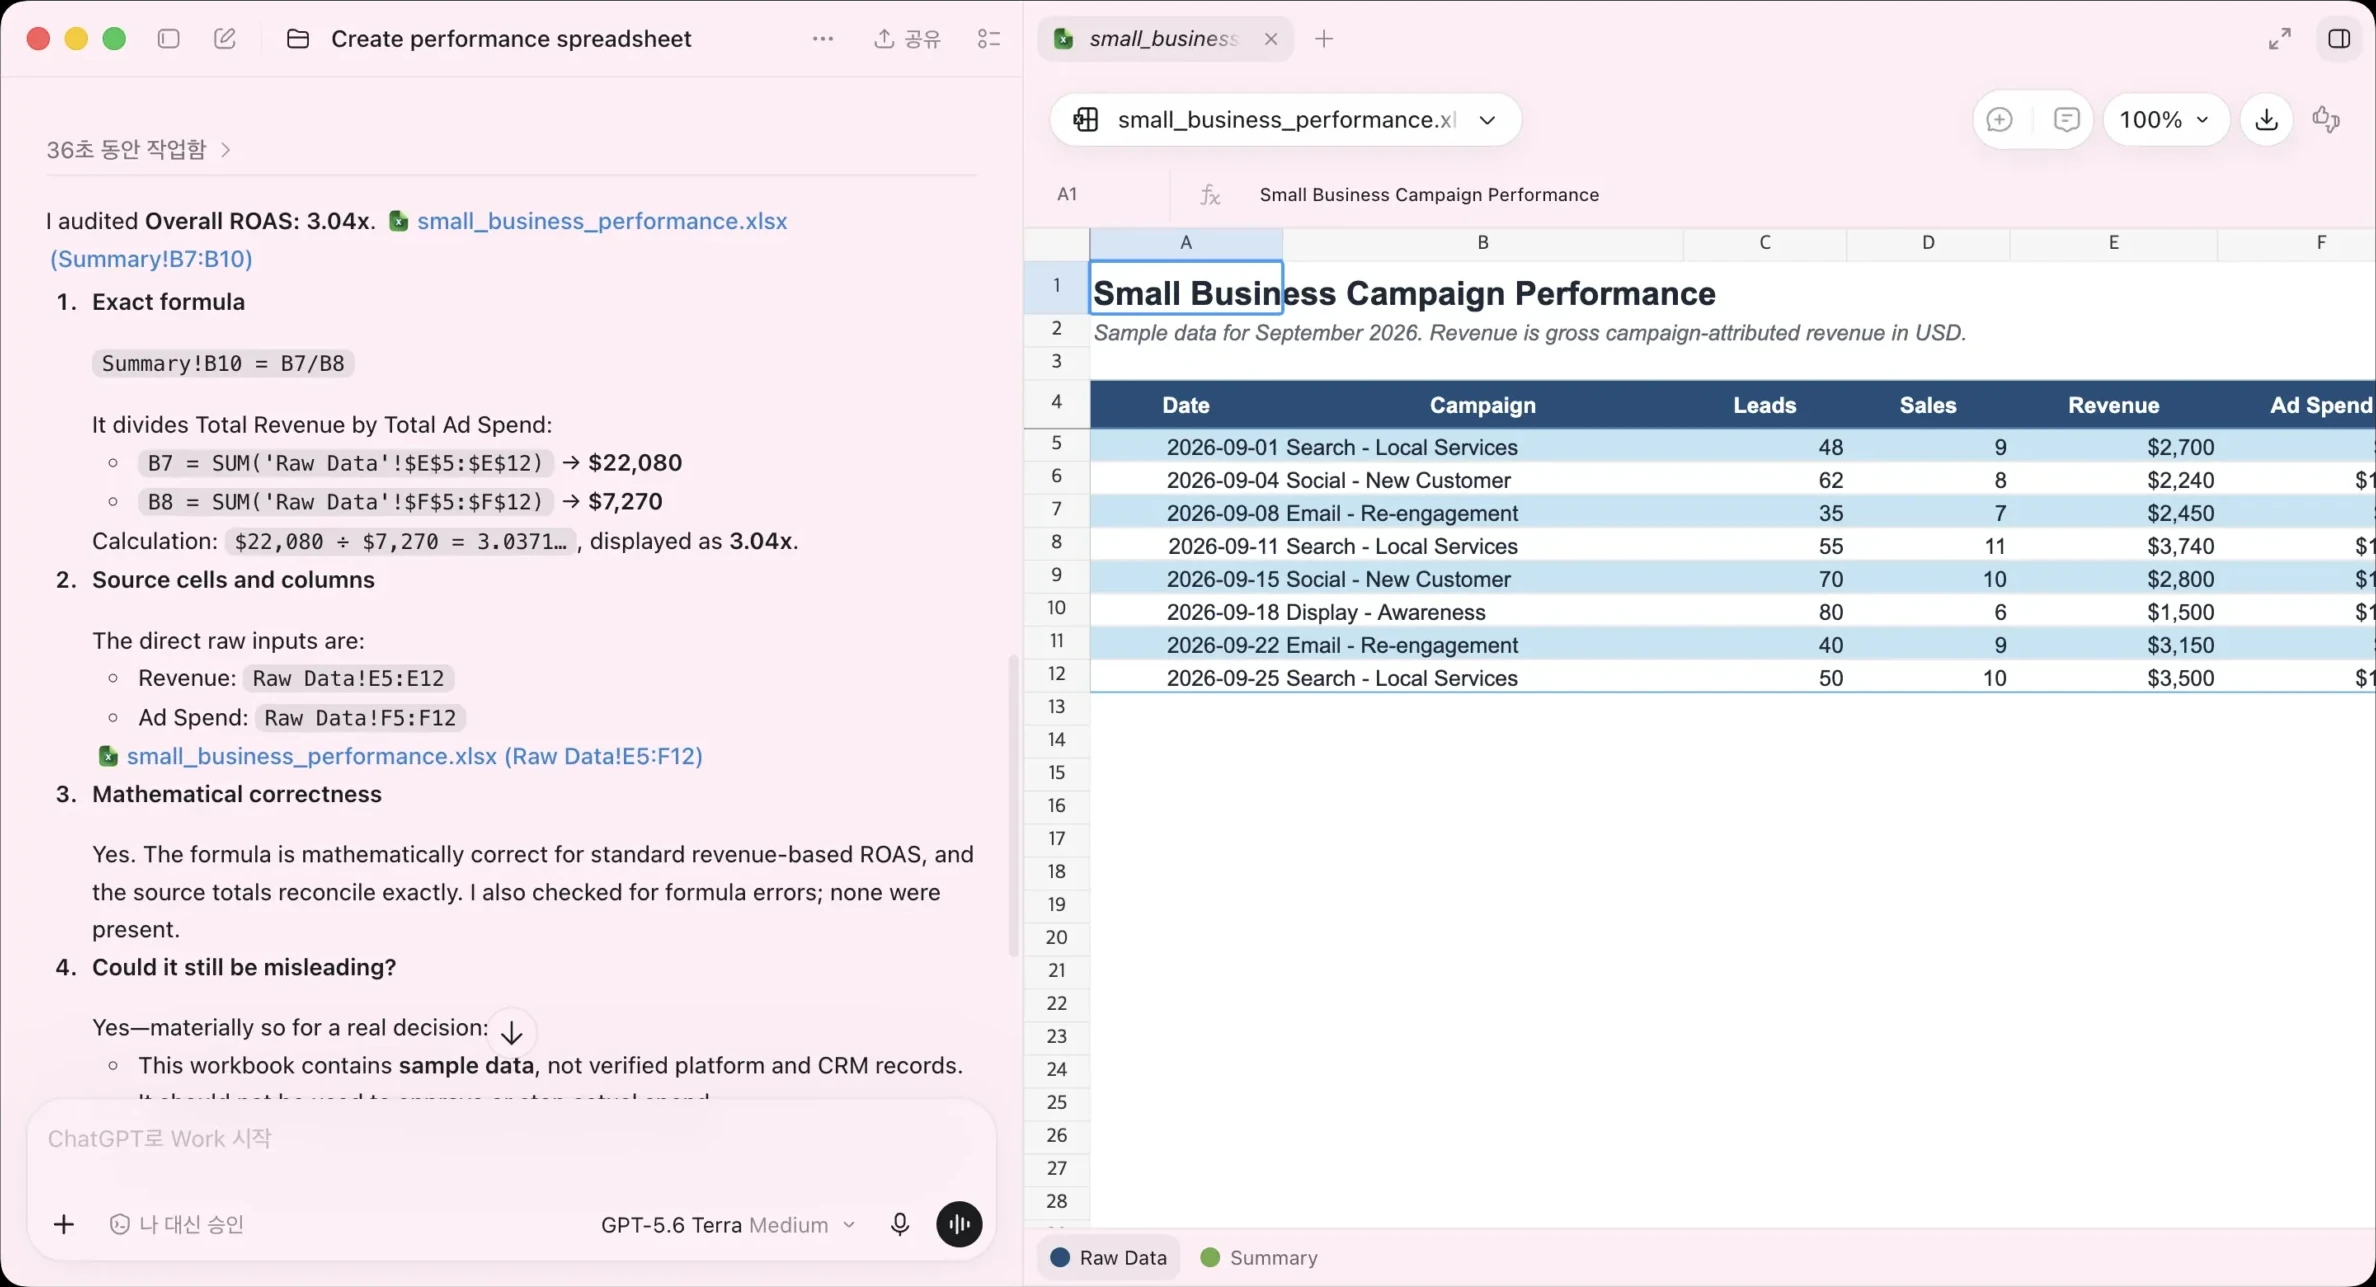
Before putting that number in a report, check what it measures and confirm that the input currencies and units are consistent. This ROAS calculation compares recorded revenue with ad spend. Refunds, product costs, and overhead haven’t been subtracted, so 3.04x isn’t a profit figure.
To review the workbook, I used this request:
Recorded prompt. Paste into the ChatGPT message box to reuse this request. Attach your workbook or supply the result formula and source cells. No placeholders; check returned cell references in your own file.
Do not give me only the final number. Identify the sheet, table, columns, row count, exclusions, and assumptions you used. Then show one representative calculation with exact cell references and tell me which result I should verify in Excel before I rely on it.
That request gave me the formula and the cells behind the 3.04x result. I could then check the division myself. The rest of the workbook still needed its own checks.
Try building a small file
Open a new ChatGPT conversation and paste the whole block below into the message box. You don’t need to upload a file or replace any text for this example. File creation depends on the tools available in your conversation; ask for a downloadable workbook first.
This practice exercise is separate from the eight-row workbook in the screenshots. I ran this exact prompt in a new ChatGPT web conversation on November 3, 2026. It returned a downloadable campaign_roas_summary.xlsx file. The interface showed Medium; I did not record a model name.
The two practice rows are already in the prompt. You can paste it as is.
Create a downloadable .xlsx workbook from the practice data below.

Make two sheets named Raw Data and Summary.
On Raw Data, put the headers in A1:C1 and the two campaign rows in A2:C3. Keep the numbers as numbers.
On Summary, put Item in A1 and Value in B1.
Put Total Revenue in A2, Total Ad Spend in A3, and Overall ROAS in A4.

Use these formulas on Summary:
B2: =SUM('Raw Data'!B2:B3)
B3: =SUM('Raw Data'!C2:C3)
B4: =IF(COUNT('Raw Data'!B2:C3)<>4,"Missing input",IF(B3=0,"N/A",B2/B3))

Keep B4 as a numeric result when all four source values are numbers and ad spend is above zero. Don't turn it into text by adding "x" to the formula.
Don't average the campaign ratios, type fixed totals into the summary, or drop a campaign.
If a source value is missing, ask me for it before calculating.

Return the file and list the three summary formulas.
If you can't create a downloadable file, say so. Return the two tables and formulas instead; don't claim a file exists.

PRACTICE DATA:
Campaign, Revenue, Ad Spend
A, 100, 20
B, 60, 30
Download the .xlsx from ChatGPT. On your Mac, open Numbers, choose File → Open, and select the file you just downloaded.
I opened the downloaded workbook in Apple Numbers and changed campaign B’s revenue from 60 to 80. The ROAS went from 3.2x to 3.6x. When I cleared that revenue cell, the summary showed Missing input. I put 60 back and set both ad spend cells to zero. That gave me N/A. After restoring the original numbers, I saved a Numbers copy and reopened it. The summary was back to 160 in revenue, 50 in ad spend, and 3.2x ROAS.
I ran those checks on the downloaded workbook in Numbers on November 4. The October 23 Excel test used a separate workbook I built from the same two practice rows. I still haven’t tested the downloaded workbook in Excel.
On Raw Data, look for both campaign rows. Then switch to Summary and compare the three cells with the table below.
| Summary cell | Formula you should see | Expected value |
|---|---|---|
| B2 — Total Revenue | =SUM('Raw Data'!B2:B3) | 160 |
| B3 — Total Ad Spend | =SUM('Raw Data'!C2:C3) | 50 |
| B4 — Overall ROAS | =IF(COUNT('Raw Data'!B2:C3)<>4,"Missing input",IF(B3=0,"N/A",B2/B3)) | 3.2, meaning 3.2x |
To try the same check, change B3 on Raw Data from 60 to 80. On Summary, B4 should show 3.60. Put 60 back in Raw Data’s B3. If B4 returns to 3.20, you’re done with the Numbers exercise. You can skip the Excel steps below.
Campaign A has a ratio of 5x; campaign B has 2x. Their simple average is 3.5x. But B accounts for more of the ad spend, so averaging the two ratios gives the campaigns equal weight when their budgets differ. For the combined result, use total revenue ÷ total ad spend: 160 ÷ 50 = 3.2x.
Copy the two-row exercise directly into Excel
Create a blank workbook and name the two sheets Raw Data and Summary. Copy the two tab-separated blocks below to build the exercise directly. These practice rows and formulas are separate from the historical workbooks and were not generated by rerunning the suggested ChatGPT prompt.
1. Raw Data: copy the first block, select A1 on Raw Data, and paste. It should fill A1:C3. Check that A and B occupy separate rows and that Revenue and Ad Spend are separate numeric columns.
Campaign	Revenue	Ad Spend
A	100	20
B	60	30
2. Summary: Copy the second block, select A1 on Summary, and paste. It should fill A1:B4. Keep the space in the sheet name Raw Data so the formulas can find it.
If everything lands in one column: Undo the paste. On Raw Data, enter the headers across A1:C1, then enter A, 100, 20 across row 2 and B, 60, 30 across row 3. If the Summary block lands in one column, enter the labels in A1:A4 and the formulas one at a time in B2:B4.
If you see the formula instead of a number: In desktop Excel, set the cell’s format to General, then edit the formula and press Enter.
Item	Value
Total Revenue	=SUM('Raw Data'!B2:B3)
Total Ad Spend	=SUM('Raw Data'!C2:C3)
Overall ROAS	=IF(COUNT('Raw Data'!B2:C3)<>4,"Missing input",IF(B3=0,"N/A",B2/B3))
3. Check the result: Summary B2:B4 should show 160, 50, and 3.2. Select B4 and check its formula in the formula bar.
4. Change and clear one input: change Raw Data!B3 from 60 to 80. Summary!B2 should become 180 and B4 should become 3.6. Clear Raw Data!B3; B4 should show Missing input. Put 60 back; the ratio should return to 3.2.
5. Check zero spend, then restore: temporarily set Raw Data!C2 and C3 to numeric 0; Summary!B4 should show N/A. Restore C2 to 20 and C3 to 30, and confirm B2:B4 are back to 160, 50, and 3.2 before saving. If the values do not update, follow the recalculation checks below.
The October 23 Excel recheck records the direct test of this two-row exercise. It does not verify the original eight-row workbook or the monthly-sales file.
Check the formula in Excel
Select the result cell and look at the formula bar above the sheet. You should see the formula rather than only a fixed result.
On the desktop Excel layout described by Microsoft, choose Formulas → Formula Auditing → Trace Precedents. “Precedents” are the cells feeding the formula; the arrows show those links. For a reference on another sheet, double-click the black arrow and choose the reference in the Go To list. Menus may differ across Excel versions. Microsoft’s formula-tracing instructions
For the original workbook, start at B10 on Summary, check B7 and B8, then inspect the two Raw Data ranges. In your own workbook, use the actual cell locations returned for your file.
If a number looks off, go back to the same ChatGPT conversation. Attach the workbook if you can, then fill in the three brackets below. For this example, give it Summary!B4 and its formula, the formulas in B2 and B3, and the rows in Raw Data!A1:C3.
Tell it what you expected to see. With the starting values, 160 divided by 50 gives 3.2. If you changed campaign B’s revenue to 80, use 180 divided by 50 and expect 3.6.
Check only this result against the supplied rows.
Show which supplied cells the formula includes and any supplied row it misses. Do not invent cell references; ask for any input cells you need but have not been given. Explain the smallest fix before changing anything.

CELL AND FORMULA: [PASTE THEM]
SOURCE ROWS AND CELL ADDRESSES: [PASTE THE RELEVANT ROWS WITH THEIR SHEET NAMES AND CELL ADDRESSES]
EXPECTED CALCULATION: [STATE WHAT THE RESULT SHOULD MEASURE]
If the summary doesn’t update
Check that you changed B3 on Raw Data. Then click B4 on Summary and look at the formula bar. A formula like =160/50 gives the right starting number, but it has no link to your data. Compare B2, B3, and B4 with the formulas in the table above.
On Excel for Windows, you can also try Formulas → Calculate Now. If that updates the result, check Formulas → Calculation Options → Automatic so later changes recalculate too. This setting can affect other open workbooks. Microsoft’s recalculation instructions
If you added another campaign, check the ranges too. The sample formulas stop at row 3. Extend both SUM ranges and the COUNT range, then update the expected number of numeric inputs.
October 23 recheck: changed inputs, missing values, and restoration
The two published practice rows were rebuilt in a separate workbook and tested in desktop Excel for Windows (version 16.0, build 20430). This October 23 check tested the formulas directly; the suggested ChatGPT file-generation prompt was not rerun during that check.
The original zero-spend formula had a gap. Clearing campaign B’s revenue produced 2.0x, just like entering a real zero. Clearing its ad spend produced 8.0x. Neither number warned that an input was missing.
The revised B4 formula now uses COUNT('Raw Data'!B2:C3)<>4 before calculating the ratio. All four input cells must contain numbers. A blank or text value returns Missing input; an actual zero still counts as a number. The SUM cells can still show partial totals, so do not use those totals until the missing input is resolved. Microsoft’s COUNT reference explains this distinction.
| Input check | Expected and observed in Excel |
|---|---|
| Original rows: 100/20 and 60/30 | Revenue 160; ad spend 50; ROAS 3.2. |
| Campaign B revenue changed to 80 | Revenue 180; ad spend 50; ROAS 3.6. |
| Both ad-spend cells set to numeric 0 | N/A, rather than a division error. |
| Campaign B revenue set to numeric 0 | ROAS 2.0. This is a supplied zero, not a missing value. |
| Campaign B revenue cleared or replaced with text | Missing input. |
| Campaign B ad spend cleared | Missing input. |
| A third campaign temporarily added on row 4 | Still 3.2: the fixed ranges exclude row 4. Extend the formulas before using more rows. |
| All inputs restored, then saved and reopened | Revenue 160; ad spend 50; numeric ROAS 3.2, displayed as 3.20x. |
To restore the exercise, put 100 and 20 in Raw Data!B2:C2, 60 and 30 in B3:C3, and remove the temporary row 4. Keep the three Summary formulas shown above. Recalculate and check B2:B4 before saving. The saved reproduction was reopened with those inputs and results intact.
This recheck covers the published two-row exercise. Separately, 22,080 ÷ 7,270 still rounds to 3.04, but the original eight-row workbook and the monthly-sales file containing Summary!E7 were not available for this recheck. Their other formulas remain unverified.
Can ChatGPT build a spreadsheet I’d use?
Yes. I’d use ChatGPT to build the first version. Having the source rows and formulas in the file gave me a way to check how the summary worked.
When you open your first file, change one input and watch the summary. In the two-row example, changing campaign B’s revenue to 80 should move ROAS to 3.6x. If the result stays put, that’s the formula I’d check first.
Evidence and check dates
- Tool: ChatGPT for the historical workbooks; desktop Excel 16.0, build 20430 for the separate reproduction.
- Model: Original ChatGPT model not recorded.
- Dates: Original session date not recorded. Excel reproduction: October 23, 2026.
- Input: Historical reported totals 22,080/7,270; separately, practice rows 100/20 and 60/30.
- What was checked: Direct Excel check: 3.2 → 3.6 after changing revenue; missing inputs, zero spend, row limits, and restore/save/reopen checked. The generation prompt was not rerun during that October check.
- November 3 generation check: Ran the prompt in ChatGPT and checked the two sheets, three formulas, and saved values in the downloaded file. On November 4, I checked recalculation in Apple Numbers and reopened a saved .numbers copy. The downloaded file’s recalculation in Excel remains unverified.
- Not checked: The original eight-row file and monthly-sales file were unavailable; their other formulas and Summary!E7 fix remain unverified.
Source status: Checked October 23, 2026: Microsoft’s COUNT, formula tracing, and recalculation guidance. The numerical results are the separate direct Excel checks above; the older ChatGPT data-analysis reference was not reverified on this date.