

Use these ChatGPT chart prompts to turn a small table into a chart based on what you want to compare. For example, “Which channel brought in the most signups?” calls for a bar chart.
- Use a bar chart to compare groups, such as signups from Search, Email, and Referral.
- Use a line chart to see how a number changes over time, such as weekly support tickets.
- Use a scatter plot to see how two numbers vary together, such as response time and satisfaction.
Start with the bar-chart prompt below and a few rows from your own table. Once you have a result, try one of the other two if it fits your question.
Start with a small table
Open a new ChatGPT conversation. Copy the bar-chart prompt below into the message box, fill in the bracketed sections, and paste your table into its Data section. Include the column headings, then send the whole block.
The three tables below use fictional data to explain the chart choices. The charts were exported from a ChatGPT run on October 28, 2026, using those tables. That run also requested static images, value labels, and all four dates on the line chart. The copy-ready prompts are for your own data; they are not a transcript of that run.
For a larger table, use the file control beside the message box to upload an XLS, XLSX, or CSV file, then send the request. File support can vary by model, plan, and workspace settings. Keep clear column headings and one record per row, with no empty rows or columns splitting the table, as OpenAI recommends.
Bar chart: compare categories
In this sample, one bar for each channel lets you compare signup counts. The channel names go along the bottom (the x-axis), and the counts go up the side (the y-axis).
Example data:
| Channel | Signups |
|---|---|
| Search | 42 |
| 31 | |
| Referral | 18 |
Fill in the category column, value column, and chart title, then paste your table into the Data section:
Create a bar chart from the table below.
Category column: [column containing the groups to compare]
Value column: [column containing the numbers to compare, including the unit]
Chart title: [what the chart should be called]

Put the categories on the x-axis and the values on the y-axis. Start the y-axis at zero and label both axes with the column names and units. Keep the categories in descending order by value. Do not combine categories or calculate new totals without asking me.
After the chart, list the values used so I can check them.

Data:
[paste your table with column headings, or write attached file]
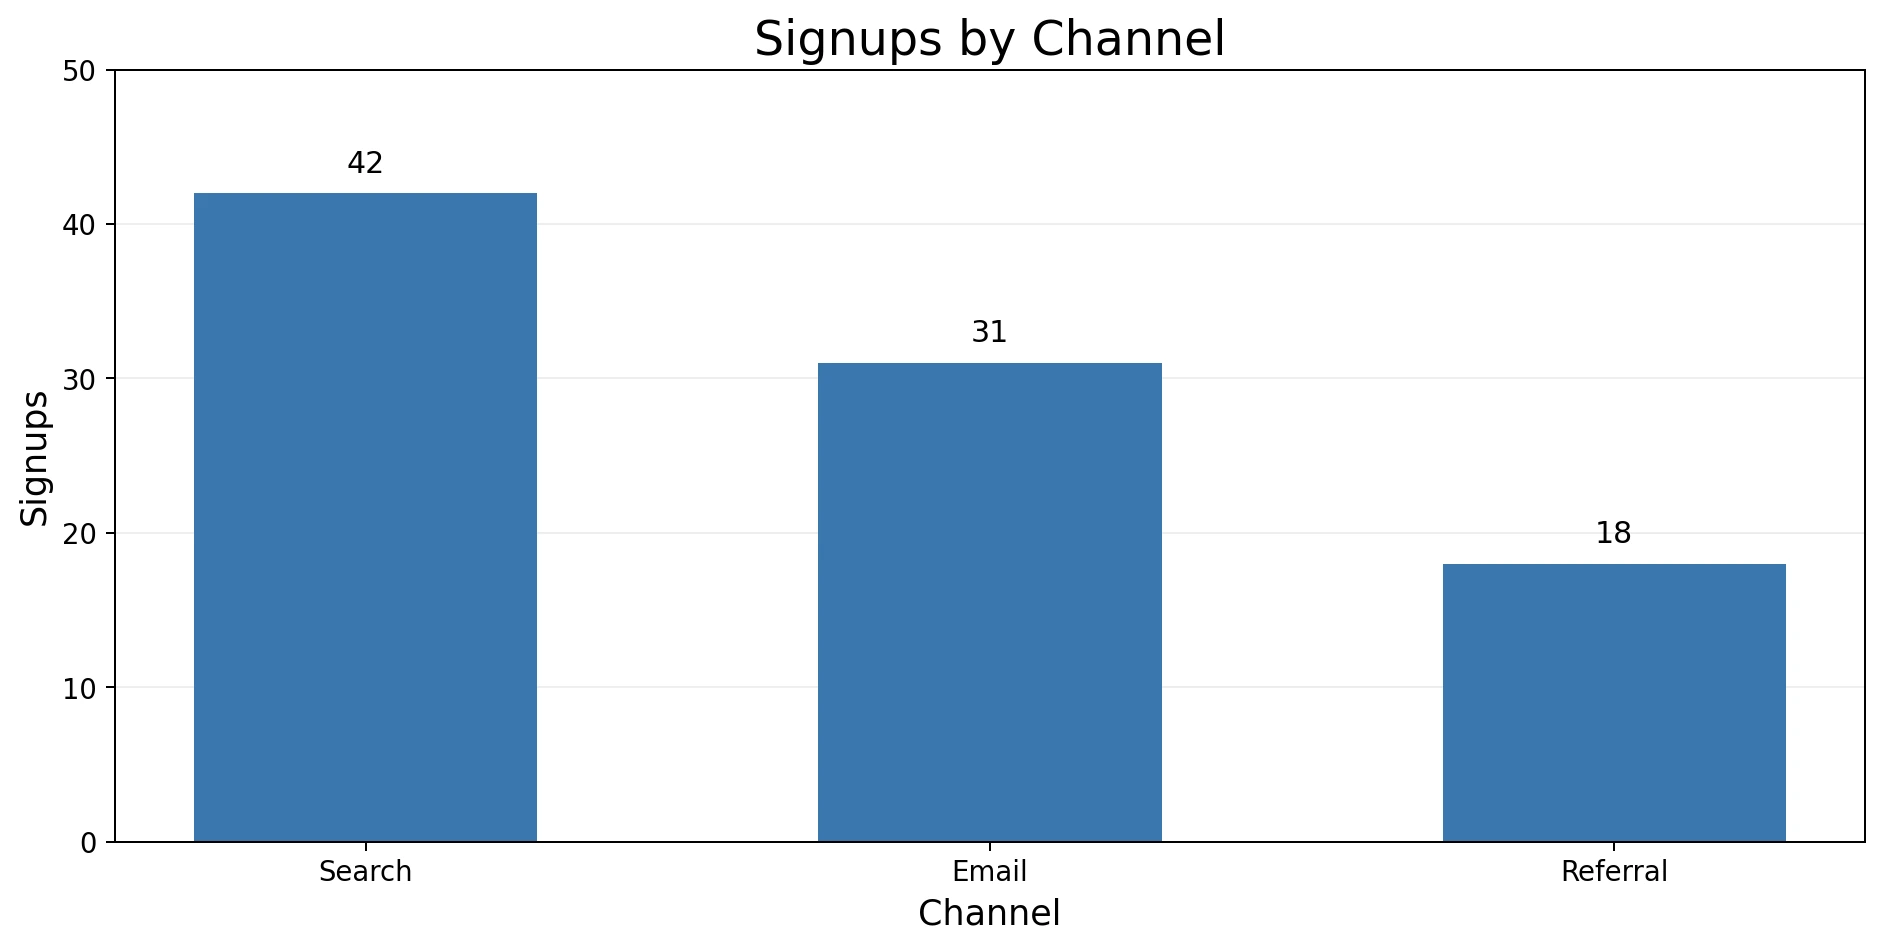
Check that every bar matches the source value and that no category was combined without your approval.
Line chart: show change over time
Use a line chart to follow the same number over days, weeks, or months. Here, each point shows how many support tickets arrived in one week.
Example data:
| Week | Support tickets |
|---|---|
| 2026-09-07 | 34 |
| 2026-09-14 | 29 |
| 2026-09-21 | 41 |
| 2026-09-28 | 37 |
Fill in the date column, value column, expected interval, and chart title, then paste your table into the Data section:
Create a line chart from the table below.
Date column: [column containing the dates]
Value column: [column containing the numbers to track, including the unit]
Expected interval: [daily, weekly, monthly, or the actual spacing of your observations]
Chart title: [what the chart should be called]

Read the date column as dates and sort from earliest to latest. Put dates on the x-axis and values on the y-axis. Label both axes with their names and units. Show missing periods as gaps, not zero. If a date is ambiguous, ask me how to read it before plotting it.
After the chart, list the dates and values used, and report any dates you could not read.

Data:
[paste your table with column headings, or write attached file]
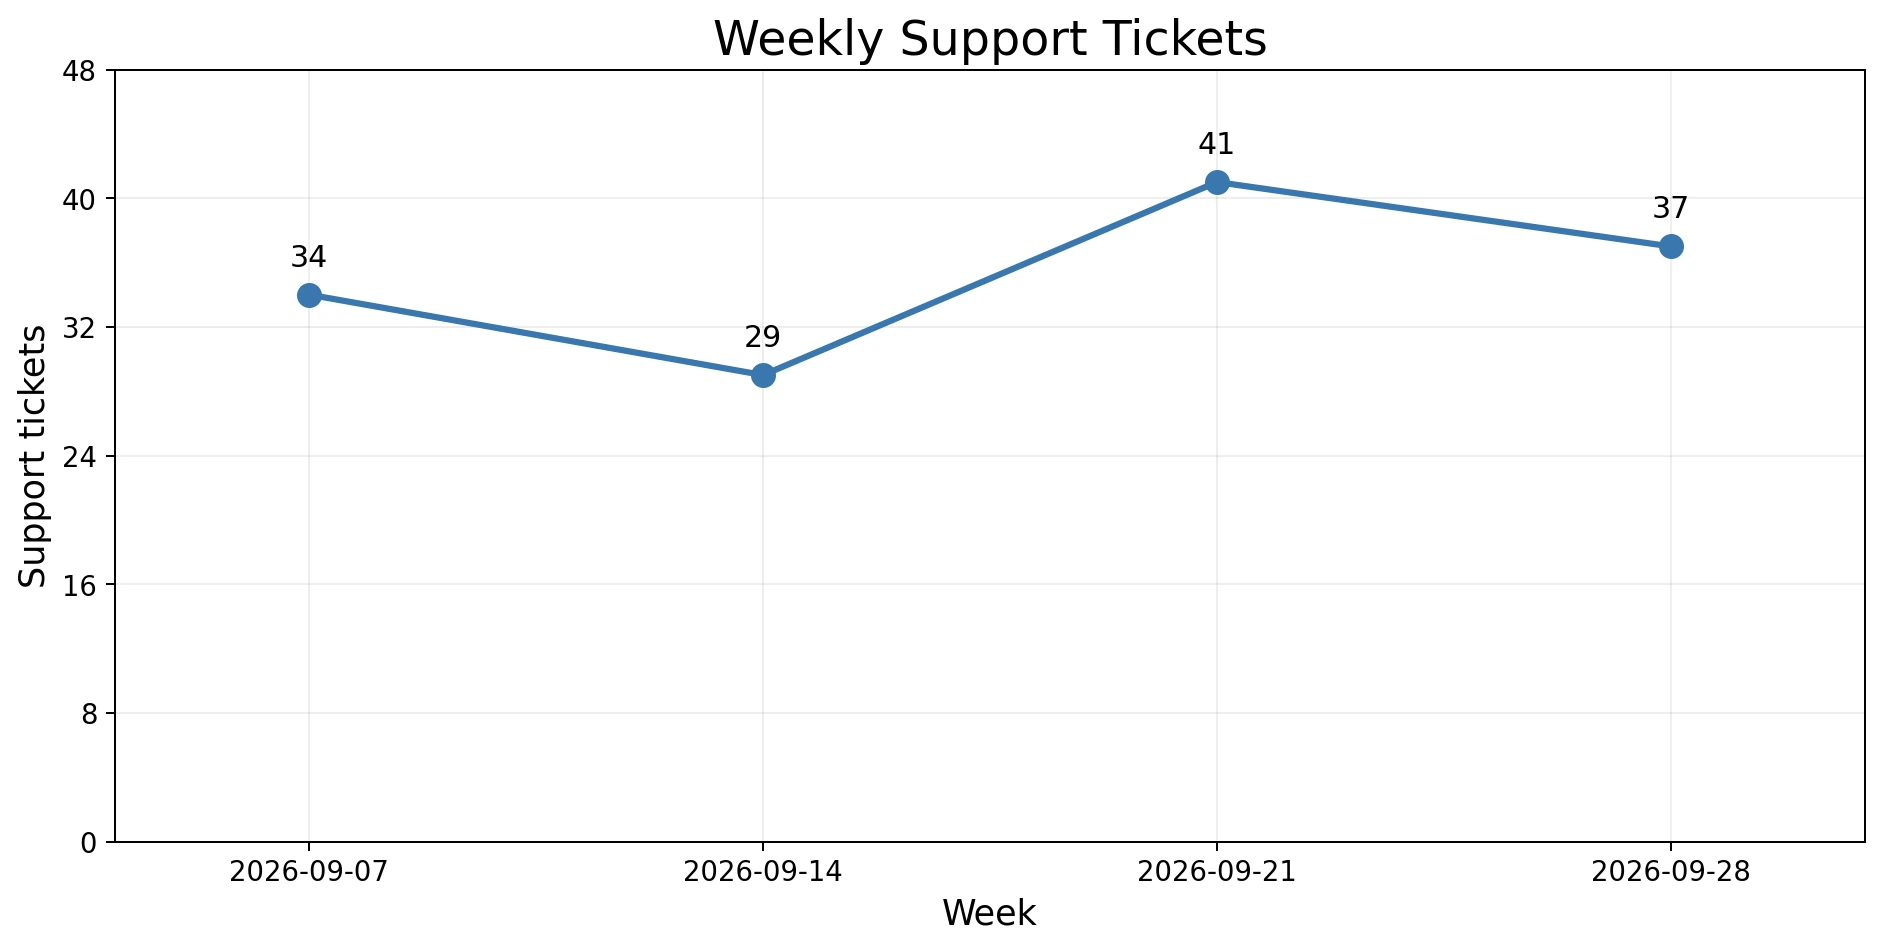
In the example chart above, the four dates are September 7, 14, 21, and 28, with ticket counts of 34, 29, 41, and 37. For your own chart, compare every plotted date and value with your source table. If dates are out of order, use the correction prompt below with your date column’s name. Keep missing periods as gaps unless zero is the recorded value.
Scatter plot: check a relationship
Each row below pairs a response time with a satisfaction score. Plotting each pair as a dot lets you look for a pattern, such as whether longer response times go with lower scores. That pattern alone does not show that response time caused the score.
Example data:
| Response time (min) | Satisfaction score |
|---|---|
| 12 | 94 |
| 24 | 88 |
| 38 | 76 |
| 17 | 91 |
| 45 | 71 |
Fill in the two numeric column names and chart title, then paste your table into the Data section:
Create a scatter plot from the table below.
X-axis column: [first numeric column name, including the unit]
Y-axis column: [second numeric column name, including the unit]
Chart title: [what the chart should be called]

Plot one point per row. Label both axes with their names and units. Do not combine rows or claim that one variable causes the other. After the chart, report any rows excluded because a value is blank or not numeric.

Data:
[paste your table with column headings, or write attached file]
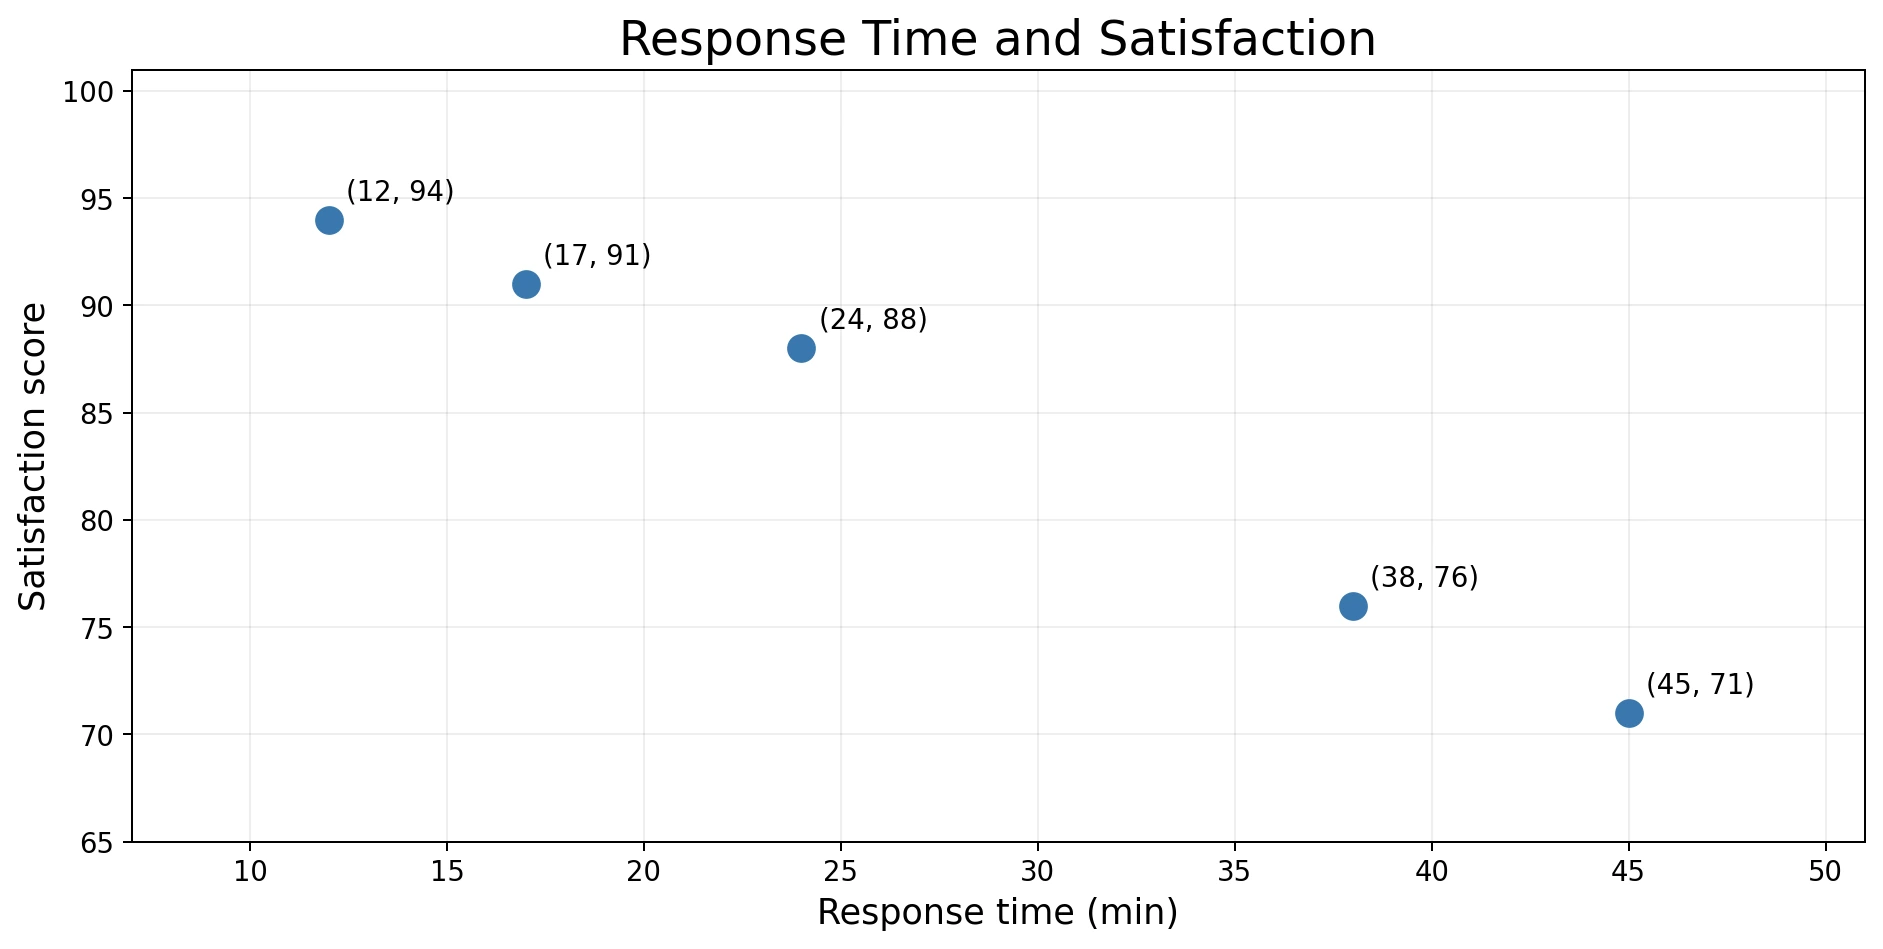
For this sample, there should be five dots. Check whether ChatGPT left out any rows before you interpret the pattern. In your own table, a blank cell or a value stored as text may explain why a row was skipped.
After checking the dots, you can add a line that summarizes their overall direction. If you want one, send this in the same chat:
Add a straight trend line to the scatter plot you just made. Keep the same x-axis and y-axis columns, units, and data points. Do not remove rows or change values. If there are too few valid pairs to fit a line, tell me instead. Describe the direction shown without claiming that one variable causes the other.
Review the chart before you use it
ChatGPT can return charts as static images, and bar, line, and scatter charts can also be interactive when that view is available. Use the interactive view to inspect points or switch back to the static image. A downloaded chart is typically a PNG.
Before you place the chart in a report or presentation, confirm:
- The axes use the intended columns.
- Dates and categories appear in the right order.
- The values behind each bar or point match your table. Check any grouping or excluded rows too.
- The title says what the chart shows without adding a conclusion the data does not support.
- Units appear in the axis labels.
If the weekly dates appear out of order, send this in the same conversation:
Rebuild the line chart using [date column name] as dates, sorted from earliest to latest. Use [the expected interval between observations] to identify missing periods. Keep missing periods as gaps, not zero, and show the dates and values used below the chart. Ask me how to read any ambiguous dates before plotting them.
Try these ChatGPT chart prompts with your own numbers
Start with a few rows from your own table. Fill in the bar-chart prompt and send it with those rows. Check that each bar matches its original category and value before using the chart.